West Coast Retina
Case of the Month
June, 2014
62-year-old man with severely reduced vision in his right eye
Presented by Sara Haug, MD, PhD

A
B
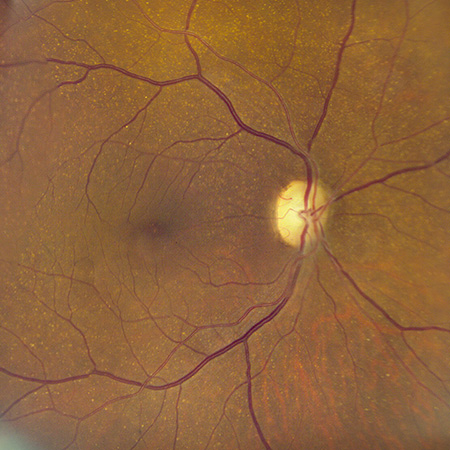
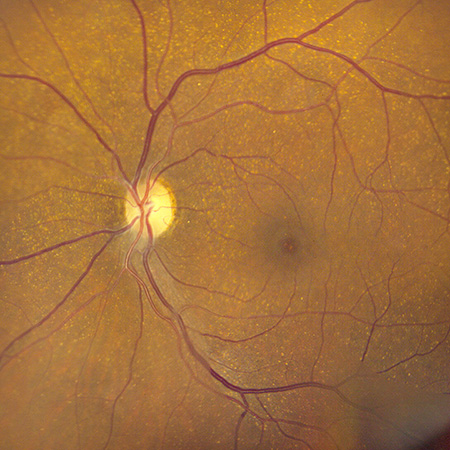
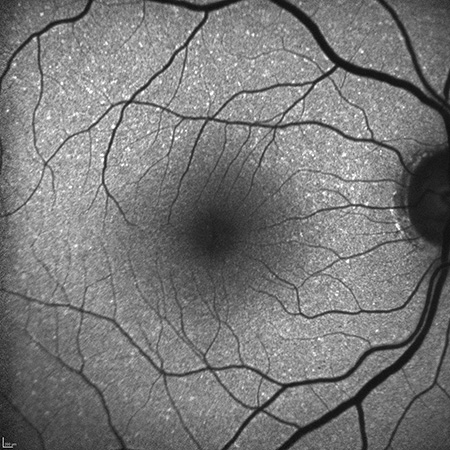
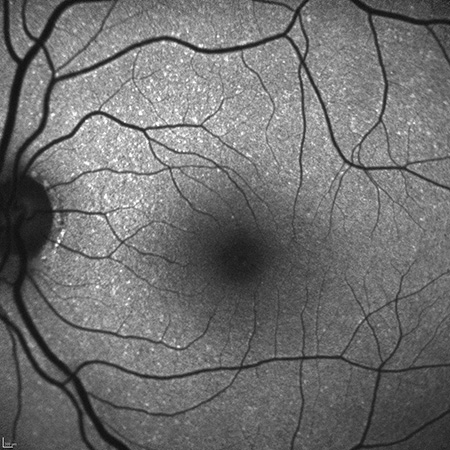
Figures 1A and B: Color fundus photographs of the right (A) and left (B) posterior pole. Scattered small drusen are seen in each eye. Some narrowing of retinal arterioles is present.
A
B
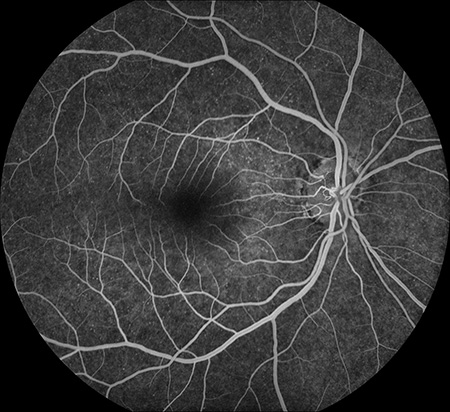
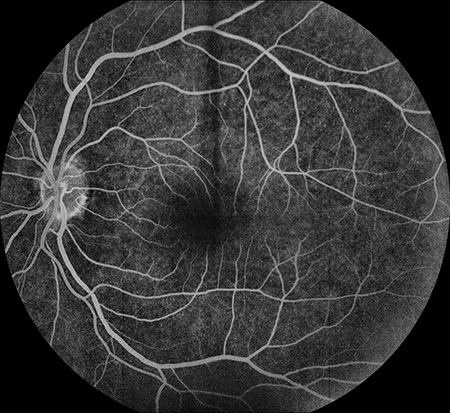
Figures 2A and B: Fluorescein angiography of the right (A) and left (B) fundus. There is complete filling of the retinal vessels in both eyes and there is scattered, punctate hyper-autofluorescence, more prominent in the left eye (B).
A
B
Figures 3A and B: Fundus autofluorescence images of the right (A) and left (B) posterior poles. There is mild speckled hyperfluroescence in both eyes but otherwise no abnormalities.
A
B
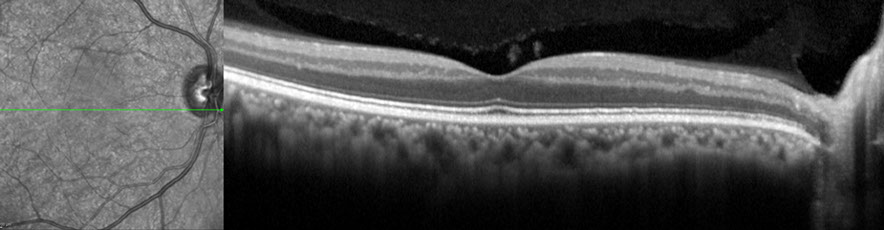
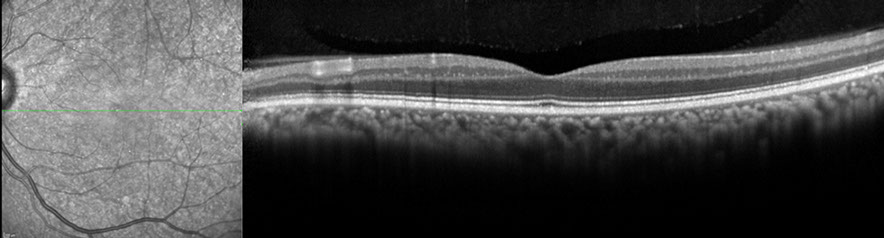
Figures 4A and B: Spectral-domain OCT images of the right (A) and left (B) eyes. The OCT is not consistent with a prior central retinal artery occlusion as the inner nuclear and inner plexiform layers are present. The outer retinal layers also have a normal appearance, bilaterally.
Differential Diagnosis
The differential diagnosis for unilateral vision loss is broad and includes; vascular etiologies such as central retinal artery occlusion, non-arteritic anterior ischemic optic neuropathy, giant cell arteritis, toxic/metabolic optic neuropathy (e.g, Leber’s hereditary optic neuropathy, methanol or ethambutol toxicity), traumatic optic neuropathy, or compressive optic neuropathy. Initial laboratory work-up was unremarkable, including a sedimentation rate and C-reactive protein level.
What is your Diagnosis?
Diagnosis
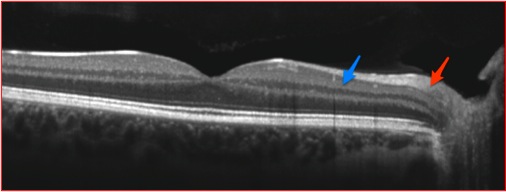
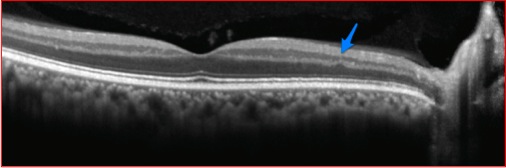
On closer examination of the SD-OCT in Figure 4, there is symmetrical loss of the nerve fiber layer and ganglion cell layer OU, indicating severe optic nerve damage. It is interesting the visual acuity was so different between the two eyes with similar nerve fiber layer loss. Figure 5 demonstrates a normal horizontal macular SD-OCT through the right eye on top (A) compared to our patient below (B). Note in the lower figure the inner plexiform layer (blue arrow, Figure 5B) is the innermost retinal layer observed versus the nerve fiber layer (red arrow, Figure 5A) in the top SD-OCT image. This finding has been termed the Dog Not Barking sign, based on the Sherlock Holmes story, Silver Blaze, in which the curious incident of the dog in the night-time was discussed. In the story, the curious incident was that the dog did not bark. Similarly, the absence of the nerve fiber layer in this case is the Dog Not Barking sign since the absence of a retinal layer indicates clinical pathology, rather then the presence of an abnormality.
An MRI of the brain was performed and a pituitary tumor was discovered. (Figure 6) Resection of the tumor was performed and pathologic analysis revealed a non-secreting pituitary adenoma. Vision has stabilized at 20/40 in the left eye; the right eye progressed to NLP and did not improve.
A
B
Figures 5A and B: SD-OCT of a normal right eye (A) and the SD-OCT image of the right eye of our patient. The red arrow in (A) indicates the nerve fiber layer, which is normal. Notice this layer is missing from (B). The blue arrow is pointed toward the inner plexiform layer in both (A) and (B), in the lower image this is the innermost layer given the loss of the ganglion cell and nerve fiber layers. The finding has been called the ‘Dog Not Barking Sign’. The posterior hyaloid is seen overlying the retina in both scans.
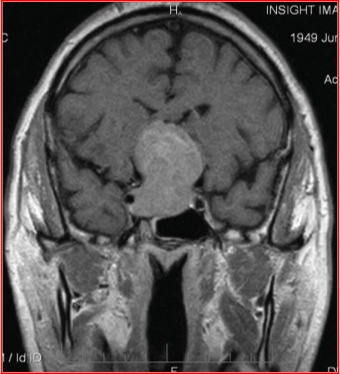
Figure 6: Coronal section of the brain showing a large, homogenous pituitary tumor
Discussion
Pituitary adenomas are benign central nervous system tumors that account for 12% of all intracranial tumors.1 Although histologically benign, pituitary adenomas can grow and extend into surrounding tissues and are a common cause of optic chiasm compression, usually resulting in bitemporal visual field defects.2
In patients with long-standing compression of the optic chiasm, ganglion cells may undergo axonal degeneration. Characteristic changes include loss of the retinal nerve fiber layer (NFL), both nasal to the disc and in the papillomacular region, with corresponding atrophy of the optic disc.2 In these cases, there is relative sparing of the superior and inferior quadrants of the optic nerve where the majority of temporal fibers enter. Thus the optic atrophy is found in a horizontal band across the disc called band or bow-tie atrophy.2-4
A number of studies have demonstrated that OCT is able to identify NFL loss in eyes with band optic atrophy and correlate the degree of NFL loss with the visual field defect.5,6 The degree of NFL loss in a patient with a pituitary adenoma can also be predictive of final visual outcome.7 In our case, OCT was used to make the diagnosis of a non-secreting pituitary adenoma. Despite resection of the tumor, vision in the right eye did not recover.
Take Home Points
Compressive optic nerve atrophy can result in progressive vision loss and may mimic primary retinal causes of vision loss.
Careful interpretation of the retinal layers on OCT is critical to detecting thinning of the nerve fiber layer that may be associated with optic nerve pathology.
Retina specialists should be aware of the OCT retinal findings associated with various optic neuropathies.
Want to Subscribe to Case of the Month?
References
- Musluman AM, Cansever T, Yilmaz A et al. Surgical results of large and giant pituitary adenomas with special consideration of ophthalmologic outcomes. World Neurosurg 2011;76:141-8.
- Johansson C and Lindblom B. The role of optical coherence tomography in the detection of pituitary adenoma. Acta Ophthalmol 2009;87:776-9.
- Unsold R and Hoyt WF. Band atrophy of the optic nerve. Arch Ophthalmol 1980;98:1637-8.
- O’Neill EC, Danesh-Meyer HV, Connell PP, trounce IA, Coote MA, Mackey DA, Crowston JG. The optic nerve head in acquired optic neuropathies. Nat Rev Neurol 2010;6:221-36.
- Kanamori A, Nakamura M, Matsui N et al. Optical coherence tomography detects characteristic retinal nerve fiber layer thickness corresponding to band atrophy of the optic disc. Ophthalmology 2004;111:2278-83.
- Danesh-Meyer HV, Carroll SC, Foroozan R et al. Relationship between retinal nerve fiber layer and visual field sensitivity as measured by optical coherence tomography in chiasmal compression. Invest Ophthalmol Vis Sci 2006;48:4827-35.
- Jacob M, Raverot G, Jouanneau E et al. Predicting visual outcome after treatment of pituitary adenomas with optical coherence tomography. Am J Ophthalmol 2009;147:64-70.